

Analytics & Dashboard
Vendor Management Analytics Dashboard for Procurement Visibility
Vendora vendor management analytics dashboard helps procurement, finance, supply chain, quality, stores, and management teams visualize vendor performance, procurement activity, PO status, ASN visibility, GRN progress, invoice aging, payment queries, supplier quality, and workflow bottlenecks.Replace manual spreadsheet reports, scattered vendor records, delayed status reviews, and disconnected procurement data with a centralized analytics dashboard built for vendor management, supplier performance, spend visibility, and executive reporting.01
Vendor Performance
Track delivery performance, quality trends, response time, pending actions, and supplier reliability.02
Procurement Visibility
Monitor RFQ, PO, ASN, GRN, invoice, payment, and vendor ticket status from one dashboard.03
Spend Insights
Review vendor spend, category-wise purchase activity, department-level trends, and buying patterns.04
Executive Reports
Give leadership clear reports on vendor health, procurement delays, risks, exceptions, and improvement areas.What Is a Vendor Management Analytics Dashboard?
A vendor management analytics dashboard helps organizations visualize vendor data, procurement activity, supplier performance, risk indicators, spend patterns, workflow delays, and operational health without manually searching records or preparing repeated spreadsheet reports.Vendora Analytics Dashboard
Vendora analytics dashboard helps teams convert vendor records, procurement workflows, and transaction data into actionable insights for faster decisions, better supplier management, and clearer procurement visibility.Why Companies Need Vendor Management Analytics
Vendor management becomes difficult when procurement status, vendor performance, spend visibility, invoice aging, payment queries, quality issues, and executive reports are prepared manually across departments.Manual Reporting Effort
Teams spend time exporting data, updating spreadsheets, collecting status updates, and preparing repeated management reports.Low Vendor Visibility
Procurement teams may not have a clear view of vendor performance, pending actions, delivery delays, quality issues, or invoice status.Delayed Decision-Making
Management decisions get delayed when vendor risks, workflow bottlenecks, spend trends, and supplier issues are not visible in one dashboard.Dashboard Workflow in Vendora
Vendora helps teams collect data from vendor workflows and convert it into reports, KPI dashboards, exception views, and decision-ready insights.Vendor Data
RFQ / PO
ASN / GRN
Invoice
Tickets
KPI Dashboard
Action Plan
Vendora Analytics Dashboard Preview
A management and procurement-side dashboard view for tracking vendor performance, workflow activity, spend trends, risks, exceptions, supplier quality, and executive KPIs.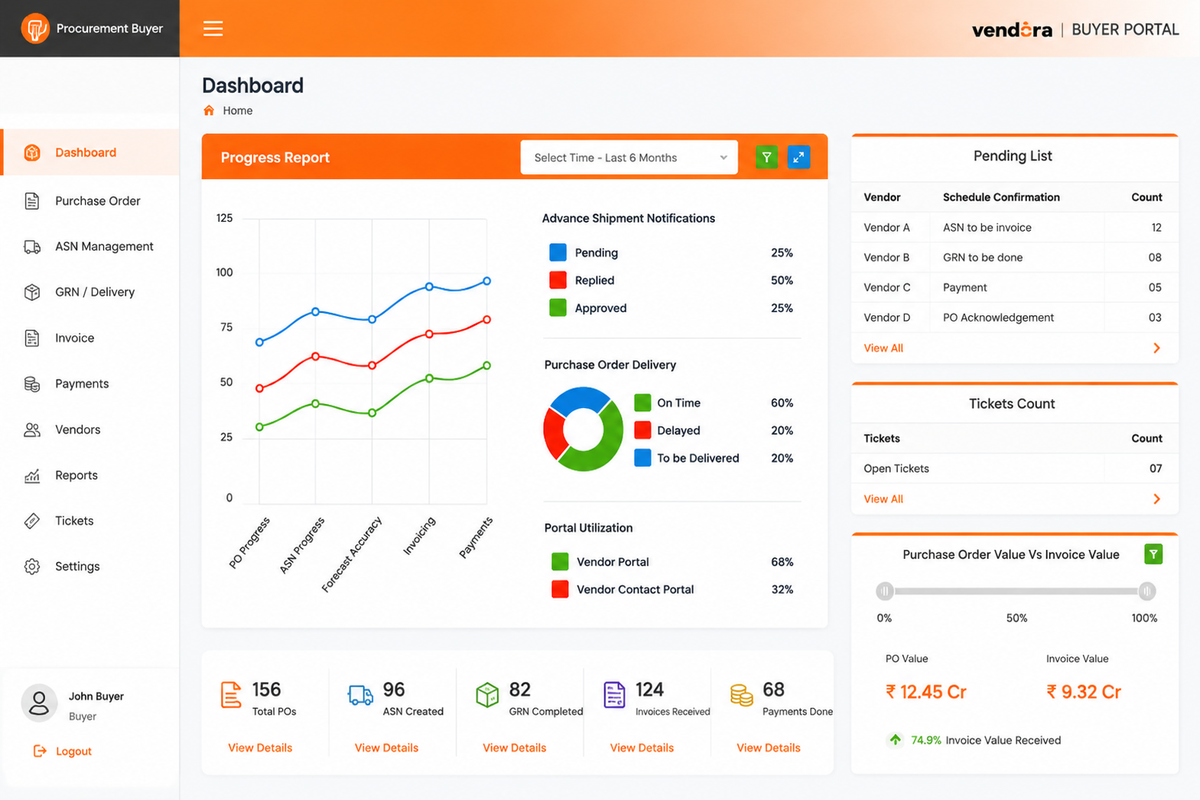 Example analytics dashboard view for monitoring vendor scorecards, procurement workflow
status, spend visibility, risks, invoice aging, and supplier performance.
Example analytics dashboard view for monitoring vendor scorecards, procurement workflow
status, spend visibility, risks, invoice aging, and supplier performance.Core Features of Vendora Analytics and Dashboard
Vendora dashboard functionality helps organizations track vendor performance, procurement efficiency, supplier risk, spend trends, contract-related indicators, and executive reporting requirements.Vendor Performance Tracking
Track supplier performance indicators related to delivery, quality, response time, compliance, and workflow completion.- Delivery performance
- Quality score trends
- Vendor response time
- Repeated exception tracking
Procurement Workflow Dashboard
Monitor open RFQs, purchase orders, pending vendor acknowledgements, ASN submissions, GRN status, and invoice progress.- Open RFQ status
- Pending PO acknowledgement
- ASN and GRN visibility
- Invoice approval status
Spend Analysis
Track and analyze vendor spend over time based on available purchase and transaction data.- Vendor-wise spend
- Category-wise spend
- Department-wise spend
- Purchase trend visibility
Vendor Risk Indicators
Identify supplier risks using delayed deliveries, repeated quality issues, invoice mismatches, pending actions, and compliance gaps.- Delivery delay risk
- Quality rejection trends
- Missing document risk
- Repeated dispute patterns
Contract and SLA Monitoring
Track agreed vendor terms, SLA expectations, renewal dates, compliance status, and contract-related reminders where configured.- Key date tracking
- Renewal reminders
- SLA visibility
- Compliance indicators
Executive Reporting
Provide leadership with summary reports on vendor performance, procurement delays, spend visibility, risk, and operational efficiency.- Management summary
- Exception reports
- Vendor scorecards
- Decision-ready insights
Invoice and Payment Analytics
Track invoice aging, payment queries, hold reasons, approval delays, missing documents, and payment visibility trends.- Invoice aging
- Payment query volume
- Approval bottlenecks
- Hold reason reports
Quality and GRN Reports
Monitor accepted quantity, rejected quantity, quality inspection trends, GRN delays, and vendor delivery accuracy.- Rejected quantity trends
- GRN cycle time
- Inspection status
- Vendor quality score
Custom Reports
Configure dashboard views and reports based on procurement process, role, department, vendor category, and management needs.- Role-wise dashboard
- Department reports
- Vendor category view
- Export-ready reports
Analytics Dashboard Before and After Vendora
Vendora helps companies move from manual procurement reporting to centralized vendor management analytics and decision-ready dashboards.| Dashboard Area | Before Vendora | With Vendora Analytics Dashboard |
|---|---|---|
| Vendor Performance | Vendor performance is reviewed manually using emails, spreadsheets, and isolated reports. | Vendor performance indicators can be viewed through dashboards and supplier scorecards. |
| Procurement Status | Teams search individual records for RFQ, PO, ASN, GRN, invoice, and payment updates. | Open workflows, pending actions, and exceptions can be tracked from a centralized dashboard. |
| Spend Visibility | Spend reports are prepared manually from ERP exports, purchase records, or spreadsheets. | Spend analysis can show vendor-wise, category-wise, and department-wise trends where data is available. |
| Risk Monitoring | Vendor risks are noticed late after repeated delays, disputes, or escalations. | Risk indicators can highlight repeated quality issues, delayed deliveries, and pending vendor actions. |
| Executive Reporting | Management reports require manual consolidation from multiple departments. | Executive reports can summarize vendor health, process delays, spend visibility, and improvement areas. |
| Action Planning | Improvement actions are based on limited visibility or incomplete data. | Teams can use dashboard insights to prioritize vendor improvement and procurement process changes. |
Benefits of Vendor Management Analytics
Analytics and dashboard functionality helps organizations optimize vendor relationships, reduce manual reporting effort, improve business visibility, and act faster on procurement exceptions.Faster Decision-Making
Procurement and management teams can quickly identify delays, risks, exceptions, and improvement opportunities.Reduced Manual Reporting
Dashboards reduce dependency on spreadsheet-based reports, repeated data collection, and manual record searching.Improved Vendor Visibility
Teams can view vendor performance, pending actions, delivery status, quality issues, and payment queries in one place.Better Cost Control
Spend analysis helps teams identify vendor-wise trends, category spend, buying patterns, and cost-saving opportunities.Risk Reduction
Risk indicators help teams act on repeated delays, quality failures, compliance gaps, and vendor performance issues.Stronger Vendor Relationships
Clear performance visibility helps buyers and vendors discuss improvement plans using data instead of assumptions.Who Uses Vendora Analytics Dashboard?
Vendora supports every team involved in vendor performance, procurement reporting, workflow tracking, finance visibility, quality monitoring, and management reviews.Procurement Teams
Track RFQ activity, PO status, vendor response, ASN progress, GRN delays, invoice readiness, and supplier performance.Management Teams
Review executive dashboards for vendor health, procurement bottlenecks, spend visibility, risks, and operational efficiency.Finance Teams
Monitor invoice aging, payment queries, approval delays, missing documents, payment status, and vendor finance issues.Quality Teams
Analyze vendor quality scores, rejection trends, defect patterns, inspection delays, and repeated supplier issues.Stores and Receiving Teams
Track ASN, GRN, received quantity, accepted quantity, rejected quantity, discrepancy trends, and receiving delays.IT and Admin Teams
Configure dashboard access, report permissions, role-based visibility, data rules, and integration requirements.Vendor Management KPIs to Track
Vendora analytics dashboard helps teams measure supplier performance, procurement speed, delivery accuracy, finance efficiency, and vendor relationship health.Vendor Score
Overall supplier performance based on delivery, quality, response, and transaction behavior.PO Acknowledgement
Pending PO confirmations, average acknowledgement time, and delayed vendor responses.ASN Submission
ASN submission rate, delayed shipments, missing shipment documents, and dispatch visibility.GRN Cycle Time
Time taken from goods arrival to GRN creation, quantity validation, and receipt confirmation.Quality Rejection
Rejected quantity, defect rate, repeated non-conformance, and vendor quality trends.Invoice Aging
Invoices pending by age bucket, approval status, missing documents, and payment readiness.Payment Queries
Vendor payment follow-ups, invoice queries, hold reasons, and finance response time.Spend Visibility
Vendor spend, category spend, department spend, and procurement trend analysis.Analytics as Part of a Connected Vendor Management Workflow
Vendora analytics dashboard is most valuable when vendor activity is connected across supplier onboarding, RFQ, purchase orders, ASN, GRN, quality inspection, invoice management, payment visibility, ticketing, and vendor performance reporting.In ERP-connected environments, SAP, Oracle, or another ERP may remain the system of record, while Vendora improves vendor-facing visibility, workflow reporting, exception tracking, and decision-ready analytics.Related Vendora Product Pages
Use these internal links to connect analytics with the wider vendor management and procurement lifecycle.Vendor Management Analytics Dashboard FAQs
What is a vendor management analytics dashboard?
A vendor management analytics dashboard helps organizations visualize vendor
performance, procurement activity, supplier risks, spend trends, workflow delays,
and executive reports in one place.
How does Vendora help with vendor performance tracking?
Vendora helps teams track delivery performance, PO response time, ASN submission,
GRN status, quality rejection trends, invoice aging, payment queries, and vendor scorecard inputs.
Can Vendora show procurement workflow status?
Yes. Vendora can help teams monitor RFQ, PO, ASN, GRN, quality inspection,
invoice, payment, and vendor ticket status through dashboards and reports.
Can analytics help reduce manual reporting?
Yes. Vendor management dashboards reduce manual report preparation by giving users
centralized visibility into vendor records, transaction status, and workflow KPIs.
Does Vendora support executive reporting?
Yes. Vendora can support executive reporting for vendor health, procurement
bottlenecks, spend visibility, supplier risks, invoice aging, and operational improvement areas.
Who uses vendor management analytics?
Vendor management analytics is used by procurement teams, finance teams, quality teams,
stores teams, supply chain teams, management users, IT users, and admin teams.
How can we evaluate Vendora analytics dashboard?
Book a product demo and share your vendor count, procurement workflow, reporting needs,
ERP system, KPI requirements, management dashboard expectations, and go-live timeline.

![A modern smartphone showing the [Vendor Portal Management System] dashboard for on-the-go vendor collaboration.](https://www.vendorascmsoftware.com/wp-content/themes/vendora/images/phone.webp)
